How to Choose the Best Solution from Toys to EVs?
Have you ever stared at the battery percentage on your smartphone wildly fluctuating, filled with confusion? Or perhaps, the moment you started your electric bike, you watched the battery indicator instantly drop from three bars to one, triggering sudden “range anxiety”? Behind these everyday annoyances lies a core technical challenge: How exactly is the capacity of the lithium batteries inside our devices “seen” and “measured”?
From cheap children’s toys to high-end electric vehicles (EVs), and from TWS Bluetooth earbuds to home Energy Storage Systems (ESS), choosing the right battery detection method is crucial. It doesn’t just affect user experience; it directly impacts the safety, lifespan, and reliability of the device. Today, we will break down the three mainstream battery capacity detection technologies. Skipping the obscure theories, we will dive straight into practical application scenarios to help you find the perfect “measuring stick” for your specific device.
How Can We Estimate Battery Level Just by Measuring Voltage?
The voltage measurement method is the undisputed “veteran” in the field of battery detection. Its principle is surprisingly simple: just like roughly judging the water level in a tank by measuring water pressure, it estimates the remaining capacity by measuring the voltage across the battery terminals. On the discharge curve of most lithium batteries, voltage drops slowly as power is consumed, providing the theoretical foundation for this method.
A Typical Voltage-to-Capacity Mapping (Based on a common 3.7V Li-ion battery)
|
Voltage Range (V) |
Battery Indicator (LEDs) |
Estimated Remaining Capacity |
|---|---|---|
|
4.10 ~ 4.20 |
4 LEDs ON |
80% ~ 100% |
|
3.90 ~ 4.10 |
3 LEDs ON |
50% ~ 80% |
|
3.70 ~ 3.90 |
2 LEDs ON |
20% ~ 50% |
|
3.50 ~ 3.70 |
1 LED ON |
5% ~ 20% |
|
< 3.50 |
Flashing or OFF |
Critically Low |
(Note: This mapping varies significantly depending on the battery chemistry—e.g., NMC vs. LiFePO4—temperature, and battery age. Never use this as a precise standard.)
In an actual circuit, implementing voltage measurement usually only requires a simple resistor divider network and an Analog-to-Digital Converter (ADC) pin on a Microcontroller (MCU). The cost is almost negligible.
// A simplified example of reading voltage via ADC (Assuming 12-bit ADC, 3.3V reference)
#define VOLTAGE_DIVIDER_RATIO 2.0 // Voltage divider ratio
#define ADC_REF_VOLTAGE 3.3

uint16_t adc_value = read_adc_channel(BATTERY_ADC_CH);
float measured_voltage = (adc_value / 4095.0) * ADC_REF_VOLTAGE * VOLTAGE_DIVIDER_RATIO;

// Next, look up a table or calculate based on 'measured_voltage' to light up corresponding LEDs
Who is this suitable for?
The biggest advantages of the voltage method are its ultra-low cost and extreme simplicity. Therefore, it dominates in scenarios like:
- Low-cost consumer electronics: Disposable electronic toys, simple remote controls, and greeting card music chips. These products are highly cost-sensitive and only need a rough “has power” or “out of power” indication.
- Entry-level E-bikes/Scooters: Many entry-level models still use LED strips to show power, which relies on the voltage method. The “instant power drop upon startup” phenomenon you see is precisely because the heavy motor load instantly pulls down the battery voltage, causing the system to misjudge the capacity.
What is its fatal flaw?
The most criticized aspect of the voltage method is its extremely low accuracy and strong load dependency. Battery voltage is not a linear function of capacity; it’s a curve affected by multiple factors:
- Load Effect: Once a load is applied—especially a high-power one like a motor—the battery’s internal resistance causes a voltage drop, making the terminal voltage instantly plunge. When the load is removed, the voltage rebounds. This causes severe jumping in the battery display.
- Temperature Impact: In cold environments, internal resistance increases, causing a larger voltage drop under the same load, making the displayed capacity artificially low. The opposite happens in high temperatures.
- Battery Aging: As cycle count increases, internal resistance grows, and the overall discharge plateau voltage drops. An old battery will always report a lower-than-actual capacity when using the voltage method.
- Why Do Specific Batteries Require Customized Charge/Discharge Lookup Tables?
To overcome the flaws of the voltage method, engineers came up with a smarter approach: Since the relationship between voltage and capacity isn’t fixed, why not pre-build an accurate “portrait”—a customized voltage-capacity mapping table—for a specific battery model under specific conditions? This is the core idea of the Look-up Table (or Modeling) method.
Instead of generic voltage segments, this method relies on experiments to tailor a specific mapping relationship for your exact batch of batteries.
How do you build a custom “portrait” for your battery?
-
Preparation: Select a batch of brand-new batteries of the same model and batch. Prepare a high-precision Coulomb counter (discussed in the next section) as a baseline tool and a controllable electronic load.
-
Data Collection:
- Static Curve: Let the battery discharge from full to empty with no load, recording the Open Circuit Voltage (OCV) at specific capacity intervals (e.g., every 5%).
- Dynamic Curve (Crucial): Simulate the device’s real-world working state. Connect the battery to a constant current load similar to the device’s typical working current, and record the terminal voltage under load at set capacity intervals.
-
Table Generation & Fitting: Input the collected data into a computer to generate curves. In the MCU, this can be stored as a look-up table or fitted into a polynomial function.
# Example: Fitting experimental data into a quadratic function (Simplified Model)
import numpy as np

# Assume experimental data: Voltage under load [V] vs Remaining Capacity [%]
voltage_data = np.array([4.02, 3.97, 3.87, 3.79, 3.73, 3.68, 3.65, 3.62, 3.58, 3.51, 3.42])
capacity_data = np.array([100, 90, 80, 70, 60, 50, 40, 30, 20, 10, 5])

# Perform quadratic polynomial fitting
coefficients = np.polyfit(voltage_data, capacity_data, 2)
p = np.poly1d(coefficients)
print(f"Fitted Function: Remaining Capacity(%) = {p}")
# Example output: -23.5*x^2 + 180.1*x - 270.2

# Inside the MCU, calculate capacity based on real-time measured voltage v: capacity = a*v*v + b*v + c
Advantages and Limitations Compared to the simple voltage method, the look-up table method offers a quantum leap in accuracy. Under ideal conditions, the error can be controlled within 5%, which is sufficient for most consumer electronics. Thus, it is widely used in:
- Smartphones and Tablets: Early smartphones primarily used this method, combining voltage and temperature data with complex compensation algorithms.
- Laptops: Driven by battery management ICs, they report capacity via calibrated curves.
- Mid-to-High-End Power Tools & Drones: These have large working currents, but storing curves for different load states significantly improves display accuracy.
(Pro Tip: To maintain accuracy, “Battery Gauge Calibration” is vital. This means periodically doing a full charge-discharge cycle so the system can “relearn” the battery’s actual degraded capacity.)
The Achilles’ Heel:
- Strict Dependency on Battery Consistency: This “portrait” is only valid for the specific batch it was modeled on. Swapping batteries (even the same model from a different batch) can shift the curve due to tiny chemical differences, causing errors.
- Struggles with Complex Loads: A device’s current is rarely constant (ranging from microamps in standby to amps under full load). A few pre-stored curves cannot cover infinite dynamic load variations.
- Complex Aging & Temperature Compensation: Capacity degrades and internal resistance shifts over time, distorting the original curve. Compensating for this requires complex algorithms and thermal sensors.
How Does a Coulomb Counter Achieve Pinpoint Accuracy by “Counting Water Drops”?
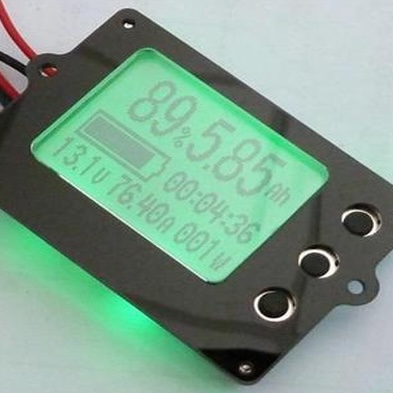
If we are not satisfied with guessing the “water level” via “water pressure,” is there a way to directly measure the volume of water flowing in and out of the tank? Yes! This is the Coulomb Counter method (often called a “fuel gauge” IC). It abandons estimation for direct measurement, utilizing the physics principle of current integration.
How does a Coulomb Counter work?
Its core consists of a high-precision, low-drift current sense amplifier and an integration calculation unit. Placed in series with the battery’s charge/discharge loop, it acts like a toll booth on a highway, monitoring every single milliampere that passes.
- Charging: It accumulates the total electrical charge flowing into the battery (current integrated over time). When the current drops near zero (full charge threshold), it updates this total accumulated capacity as the new “Full Charge Capacity.”
- Discharging: It accumulates the total charge flowing out of the battery.
- Remaining Capacity: It’s a simple subtraction: Remaining Capacity = Full Charge Capacity – Accumulated Consumed Capacity.
// Conceptual code demonstrating Coulomb Counter integration
float full_charge_capacity_mAh = 3000.0; // Current full capacity (will update dynamically)
float remaining_capacity_mAh = 3000.0;   // Remaining capacity
float current_ma; // Real-time current: positive for charging, negative for discharging
unsigned long last_time_ms, current_time_ms;
float delta_time_hours;

void update_coulomb_counter() {
    current_time_ms = get_system_time();
    delta_time_hours = (current_time_ms - last_time_ms) / 3600000.0;

    // Integrate current: Capacity change (mAh) = Current (mA) * Time (h)
    remaining_capacity_mAh += current_ma * delta_time_hours;

    // Boundary protections
    if (remaining_capacity_mAh > full_charge_capacity_mAh) {
        remaining_capacity_mAh = full_charge_capacity_mAh;
    } else if (remaining_capacity_mAh < 0) {
        remaining_capacity_mAh = 0;
    }

    last_time_ms = current_time_ms;
}

// Calculate remaining capacity percentage (SoC)
int get_soc_percentage() {
    return (int)((remaining_capacity_mAh / full_charge_capacity_mAh) * 100.0);
}
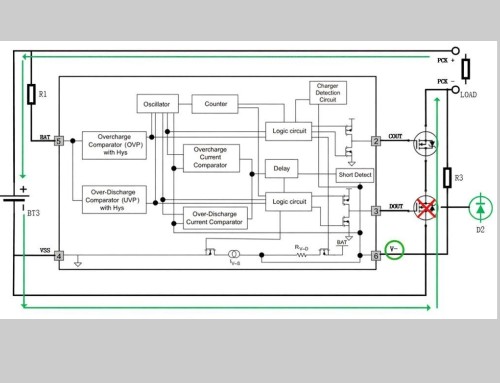
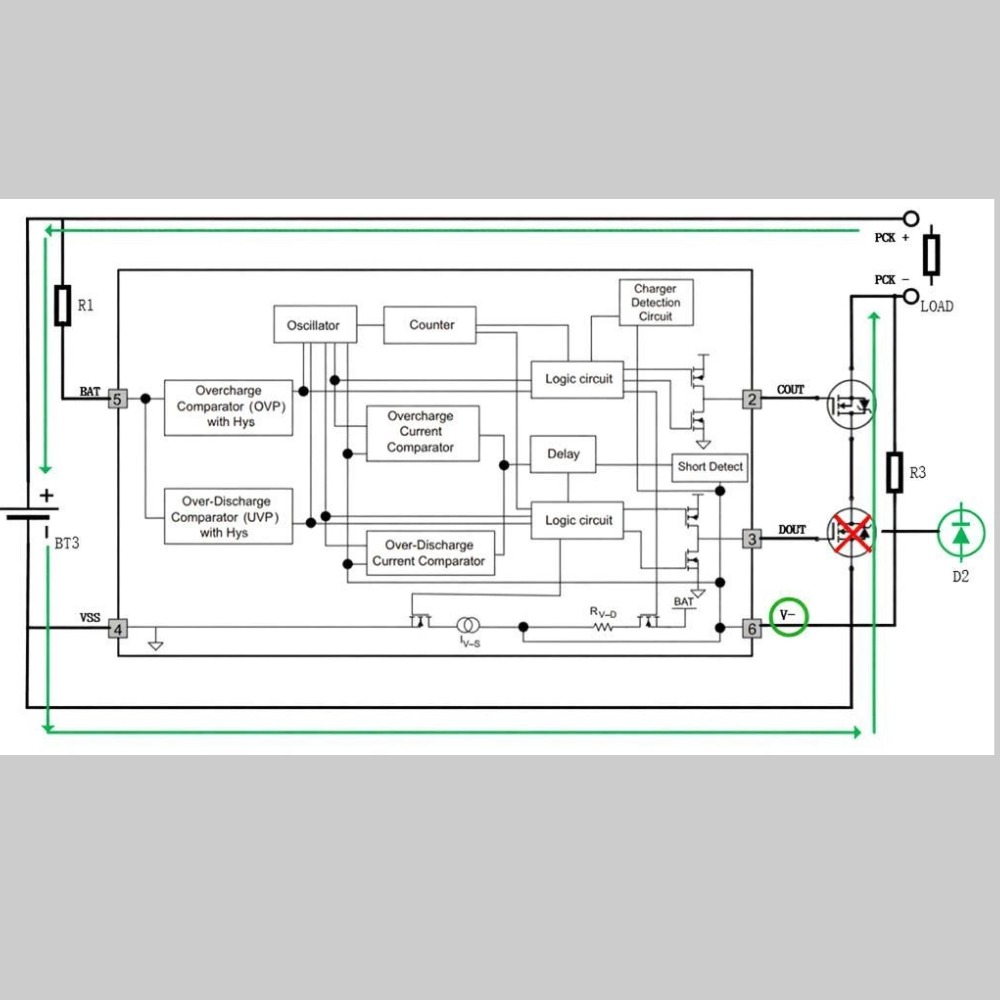
Key Technological Implementations
Modern Coulomb counters are usually highly integrated chips (like TI’s BQ series or Maxim’s MAX series) containing:
- High-precision ADC: Measures battery voltage and the tiny voltage drop across a sense resistor (to calculate current).
- Temperature Sensor: For thermal compensation of measurements.
- Integrator & Registers: Real-time current integration and data storage.
- Smart Algorithms: Automatically learns battery characteristics, updates full capacity, compensates for aging, and predicts runtime.
- Communication Interface: Reports voltage, current, temp, remaining capacity, and State of Health (SoH) to the host via I2C/SMBus.
Who MUST use a Coulomb Counter?
When accuracy, reliability, and safety are non-negotiable, this is the only choice:
- EVs and HEVs: The pinnacle of Coulomb counter application. Precision SoC and SoH management dictate safety, range, and longevity for battery packs worth thousands of dollars.
- Premium Smartphones & Laptops: Devices like iPhones and MacBooks use these chips to deliver smooth, accurate percentages and time-remaining predictions.
- Professional Drones: Accurate capacity means safe return-to-home.
- ESS and Data Center UPS: Every watt-hour matters for revenue and backup guarantees.
- Medical Devices: Portable monitors and infusion pumps must know exact remaining runtimes to guarantee patient safety.
Challenges & Maintenance:
- Initial Calibration: A new chip requires a full charge-discharge cycle to learn the battery’s true initial capacity.
- Resistor Precision & Thermal Drift: The bedrock of current measurement is the sense resistor. Its accuracy and temperature coefficient directly dictate integration results.
- Self-Discharge: Batteries lose power while sitting idle. Good fuel gauge algorithms must estimate and subtract this invisible loss.
- How Should You Choose the Right Battery Detection Scheme for Your Project?
Understanding the theories is one thing; making a product decision is another. It’s a holistic choice involving BOM cost, user experience, and product positioning.
Decision Matrix: Key Questions to Ask Yourself
What is the price segment of my device?
- Ultra-low cost (<$1.50): Voltage method is the only realistic choice. Use 2-3 LEDs for rough indication.
- Consumer grade ($10 – $50): Look-up Table method offers the best ROI, provided you invest time in battery profiling.
- Mid-to-High/Professional (>$100): Highly recommend a Coulomb counter IC. It vastly elevates product quality and eliminates battery-related customer complaints.
What is the user’s tolerance for accuracy?
- “Has power/Dead” is fine: Toys, simple remotes → Voltage Method.
- Needs reliable bars/percentages: Power tools, mid-range speakers → Look-up Table (well-calibrated).
- Requires 1% precision and runtime prediction: Smart devices with screens, EVs, medical gear → Coulomb Counter.
What does the device’s load profile look like?
- Small, steady static current: Thermometers. Voltage or Table methods work fine.
- High dynamic range with pulse loads: Walkie-talkies, motor-driven gear. The voltage method will heavily distort; Coulomb counter is the most robust.
Is the battery replaceable?
- Built-in (Non-replaceable): Table and Coulomb methods shine here as they can be highly optimized for that specific cell.
- User-Replaceable (e.g., AA battery compartments): Voltage method is the most adaptable. Table methods will fail if brands are mixed, and Coulomb counters require relearning after every swap.
- Hybrid Strategies: Getting the Best of Both Worlds In real-world high-end designs, engineers often mix methods:
- Coulomb Counter as Main + Voltage as Backup: The most mature architecture. The Coulomb counter tracks precise daily usage, while the voltage method triggers hard hardware protections (over-charge/discharge) and corrects the Coulomb counter’s drift after long periods of inactivity.
- Multi-Curve Table + Current Compensation: If a dedicated IC is too expensive, developers can measure real-time current and dynamically select (or interpolate) different voltage-capacity curves based on the load size, significantly boosting dynamic accuracy.
A Concrete Design Flow Example
Imagine we are designing a high-end TWS Bluetooth earbud that requires an exact battery percentage displayed on a smartphone app.
Select Scheme: High precision required for a smart portable device -> Coulomb Counter. We select a highly integrated micro fuel gauge IC (e.g., TI BQ27421), which has built-in battery profiles to simplify design.
Hardware Design:
- Place a high-precision, low-temperature-drift sense resistor (e.g., 5mΩ) in series with the battery’s positive output path.
- Wire the fuel gauge IC’s current detection pins across the sense resistor.
- Connect the IC’s voltage pins to the battery terminals.
- Hook up the IC to the main Bluetooth SoC via the I2C interface.
Software & Calibration:
- Write drivers to read direct data from the IC (voltage, current, temp, remaining mAh, SoC %).
- Before leaving the factory, run the earbuds through one full charge/discharge cycle so the IC learns the true cell capacity.
- Fetch the SoC% via Bluetooth protocol and display it on the app.
Testing & Validation:
- Test capacity consistency across extreme temperatures.
- Simulate user habits (playback, standby, calls) to ensure linear battery drop.
- Conduct long-term aging tests to verify the IC’s capacity relearning features.
Ultimately, users of these earbuds will enjoy a smartphone-level battery experience, never suffering the embarrassment of “I listened for an hour, it stayed at 100%, and then instantly died.” In an era where battery chemistry isn’t seeing overnight breakthroughs, the ability to accurately “read” the battery has become a core competitive advantage for product differentiation.